Gainesville real estate this year had a slow start, with an activity peak in late March followed by another activity peak in June and July.
Overall we have seen about a 25% drop off in homes listed for sale and homes actually selling. The percentage of listed homes for sale actually closing is about the same as it has been for the last few years.
We have seen about 1,000 homes sell so far this year in Alachua County. (this is homes, not condos, vacant land, etc.)
The Stats
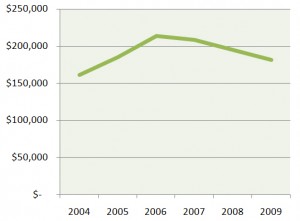
Take a look at how the median sale stacks up in price and size compared to prior years:
| Year Sold | Sell Price | Year Built | Size | Market Time |
| 2004 | $ 161,000 | 1992 | 1,647 | 85 days |
| 2005 | $ 185,000 | 1993 | 1,659 | 78 days |
| 2006 | $ 213,758 | 1995 | 1,647 | 84 days |
| 2007 | $ 208,500 | 1995 | 1,621 | 105 days |
| 2008 | $ 195,200 | 1993 | 1,644 | 122 days |
| 2009 | $ 181,000 | 1993 | 1,650 | 119 days |
As you can see, prices have come down from their peak, and many homes are selling in the same price ranges as we saw in 2005 prior to “the bubble”.

